Distributed systems aren’t short on data. They’re short on answers.
When something degrades, the on-call engineer has six questions and no time: what failed, when did it actually start, what changed, which service is the source and which is a victim, what is the evidence — and how sure am I?
Prometheus, Grafana, Loki, Tempo and Jaeger can all show the data needed to answer those questions. None of them answer them: they render, and the human correlates. Traya mechanizes that correlation for the common cases. The scarce resource it optimizes is engineer time-to-understanding, not data volume.
Three ideas that make correlation mechanical.
- One store for all signals. Metrics, logs and traces live in one analytical engine, ClickHouse, so correlation is one query domain instead of three tools joined by hand.
- Change events as first-class telemetry. “What changed just before this broke” is the highest-value correlation input, and the one most stacks never ingest.
- Topology-aware blame. A dependency graph inferred live from traces tells a failing provider from a suffering consumer, so investigation starts at the cause instead of the loudest symptom.
The result, in the shape the README gives it: not “checkout latency is high”, but checkout is the victim, redis is the source — 637 errored spans in EVAL, onset 1.4 minutes before the symptom, CPU normal so not saturation, confidence High (0.87).
An event backbone you can replay, and one intelligence tier.
- Idempotency everywhere. At-least-once delivery is a given, so every signal carries a deterministic key; redelivery is a no-op through
ReplacingMergeTreein ClickHouse and upserts in Postgres. - Traces stay whole. Spans are partitioned by
trace_id, so a whole trace lands ordered on one partition, with no cross-partition shuffle to assemble it. - Poison never blocks. Unparseable records go to a dead-letter topic with the error attached; the stream keeps moving.
- Traya monitors itself through Prometheus and Grafana on a separate path — a down system can’t be relied on to report itself down.
Detection, blame and confidence — each one inspectable.
Detection on robust statistics
Ordered rules, first match wins, each requiring a robust z-score against a sliding median + MAD baseline, sustained for a
FORwindow. The recorded onset is when the series actually broke from baseline, not when the alert fired — correlation searches backward from there.One failure, one incident
One failure produces one incident, not forty alerts: related breaches attach to the open incident, and services get explicit
sourceandvictimroles. Analysis starts from the victim, because a failing provider’s own metric often fires before the user-facing symptom it causes.Scoring that keeps membership and direction apart
Candidates in the blast window are scored on four weighted terms. An earlier version graded topology by hop distance and double-counted proximity, letting a knock-on anomaly on the victim outrank the dependency that actually broke; that regression is now pinned by a test.
score = 0.35·temporal(Δt) + 0.25·topological
      + 0.20·strength(z)  + 0.20·directionality
Confidence that admits a tie
Ranking measures the gap between the top candidate and the best one blaming a different service. Under 0.15 separation the label is
Competing. It is an honest heuristic and never presented as a probability.separation = 1 − rival / top confidence = top × (0.55 + 0.45 × separation) High ≥ 0.70 · Medium ≥ 0.45Negative evidence, shown as prominently as positive
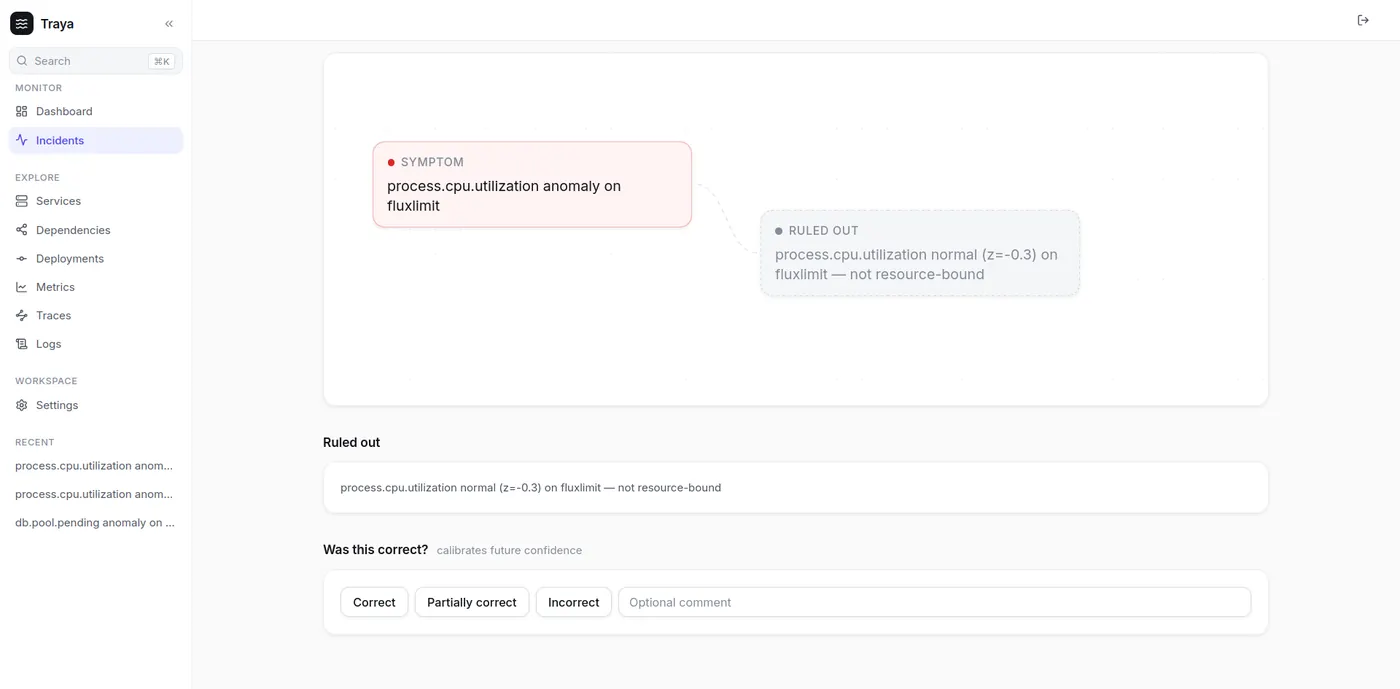
Every verdict ships ranked hypotheses, an evidence chain, and what was ruled out — “CPU normal, not resource-bound” — plus a feedback control that records whether the call was right.
A sort key that does two jobs
ClickHouse orders by
(tenant_id, service_name, name, ts): a series scan is contiguous, and tenant isolation rides the sort key for free.
What I chose, and what it cost.
- Why no machine learning in the detection path?
- On day one there are no labels, and unsupervised anomaly detection without a feedback loop relocates false positives rather than removing them. So detection is rules over robust statistics — and every verdict’s feedback lands in
rca_feedback, the corpus a learned ranker would need later. - Why is the intelligence tier one deployable?
- Correlation, RCA and the dependency graph are chatty and share an in-memory world model. Incident volume is tens per day while analysis depth is expensive, which scales vertically. The sub-modules sit behind interfaces — each a future service boundary.
- Why two databases?
- ClickHouse makes correlation one query domain, but it isn’t transactional. Incidents, evidence and analyses need transactions and read-your-writes, so the control plane lives in Postgres.
- Why reactive code only at the gateway?
- The ingest edge is I/O-bound fan-in, and backpressure maps directly onto “absorb bursts, produce at Kafka’s pace.” Reactive code is harder to debug, so WebFlux is confined to that one service. Elsewhere, Java 21’s virtual threads make blocking query fan-out cheap.
- Why Kafka, given the operational weight?
- Partitioned, replayable and ordered per key, with additive-only schema evolution enforced in CI. The cost is accepted: it is operationally heavy. What it buys is that a ClickHouse outage mid-ingest pauses consumers with offsets uncommitted, and replays on recovery.
Measured under load, and under failure.
| k6 overload test, gateway, 50 s | Result |
|---|---|
| Requests sent | 115,482 |
| Shed with 429, lowest-value signal first | 62,029 |
| Accepted | 53,453 |
http_req_failed, gateway healthy afterward | 0.00% |
| ClickHouse outage mid-ingest, chaos suite | zero loss |
| Dashboard ↔ api-bff contract | Pact, both sides |
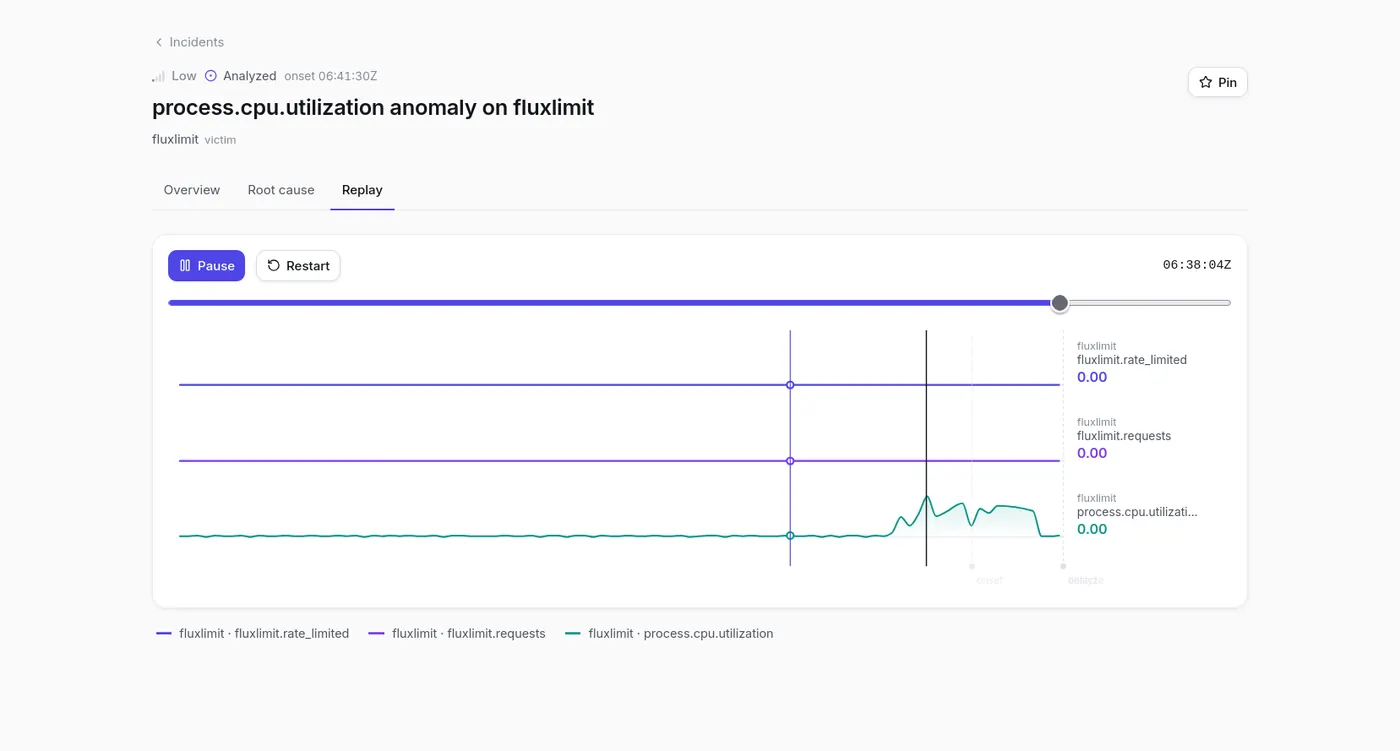
Integration tests run against real Kafka, ClickHouse, Postgres and Redis through Testcontainers. Planned: a Kubernetes and Terraform substrate, a learned RCA ranker trained on recorded feedback — only then does confidence become a calibrated probability — and reference integrations beyond FluxLimit.